
At the time of publication, many studies cite the Lenzen study for 2013 tourism emissions figures, in which tourism emissions are calculated 8% of global emissions. In just a decade, we now know that this number has risen to 8.8% – a net increase of 1.5 Gt in 10 years.
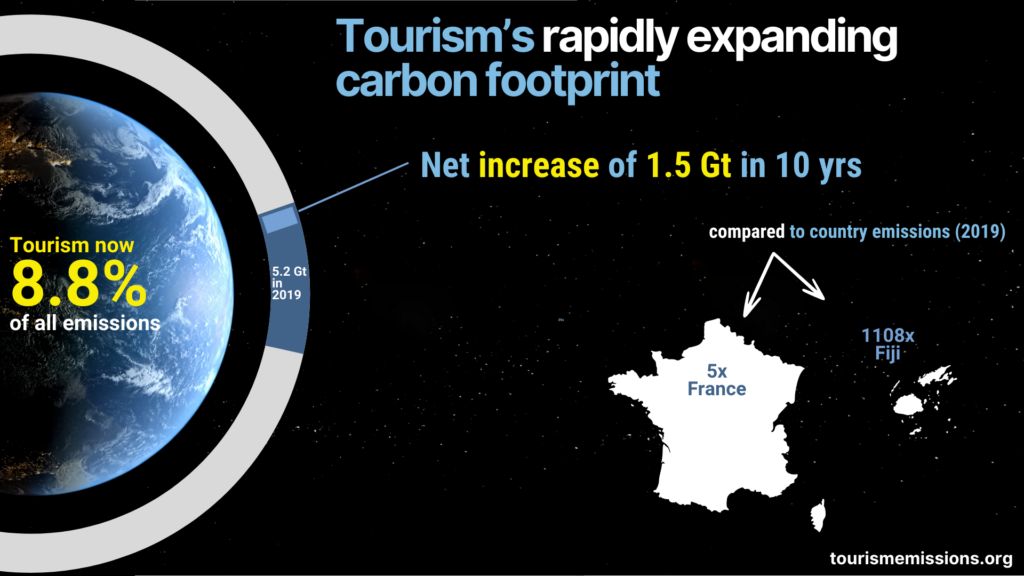
Tourism carbon footprint in 2019 (5.2 Giga tonnes or 5,200,000,000 tonnes)
Contribution to the global emissions (8.8%)
Direct emissions amounted to 1.8 Gt (52% from aviation, 18% from road transport), indirect emissions were 2.5 Gt (34% from utilities, 14% from petroleum manufacturing), and private vehicle emissions added 0.9 Gt.
The footprint presented here covers emissions produced by inbound, outbound and domestic travel for 175 countries. We differentiate emissions produced by local businesses, foreign producers, international flights, and private vehicle use. The study offers the first comprehensive evidence and analysis of global tourism carbon emissions when tourism demand peaked in 2019.
When compared to the annual emissions of France or Fiji, this net increase between 2009 and 2019 is five times that of France and 1,108 times that of Fiji.
Use of this infographic
This infographic is intended for illustrative and informational purposes. Copyright 2024 tourismemissions.org. All rights reserved.
When using these infographics, please include the following source acknowledgement: Source: tourismemissions.org
Readers should download the full published paper for detailed research results, methodology, more detail around data sources and other relevant research parameters.