
One major purpose of this study is to track how rapidly tourism carbon footprint (CF) has increased over a decade (2009-2019).
- Net tourism emissions growth between 2009-2019: 1.5 Gt CO2-e
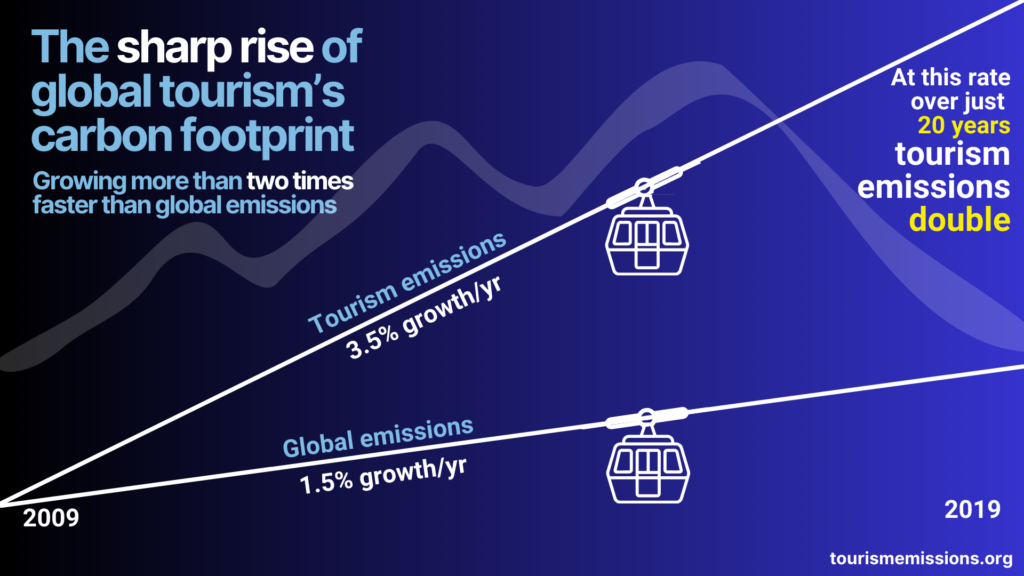
- Growth rate of tourism emissions per year (3.5%)
- Growth rate of global emissions per year (1.5%)
- Tourism emissions growth rate is 2.3 times higher than the rest of the economy.
This information allows us to benchmark tourism against other sectors and highlights the urgency of why we need to address it. It also allows us to project that, if business-as-usual continues (meaning no effective mitigation policies are put in place and demand continues to grow), tourism carbon emissions will grow, and by how much.
Significantly – if current growth rates are maintained, tourism emissions will double in just 20 years.
Use of this infographic
This infographic is intended for illustrative and informational purposes. Copyright 2024 tourismemissions.org. All rights reserved.
When using these infographics, please include the following source acknowledgement: Source: tourismemissions.org
Readers should download the full published paper for detailed research results, methodology, more detail around data sources and other relevant research parameters.