
It’s important to consider why the tourism carbon footprint has grown so fast.
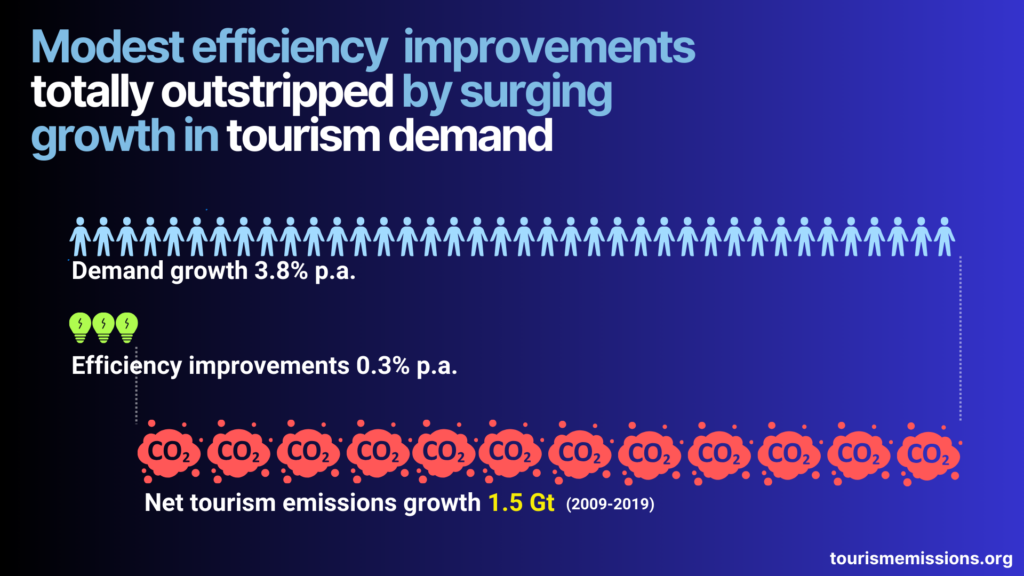
As this infographic shows, the simple answer is that we demand too much travel, while technological improvements in businesses simply cannot keep up with this growth. This is crucial information as it forms the basis for the recommendation that a demand control strategy for the tourism industry to mitigate emissions is required.
Overall, production factors (technology and the supply chain) only offset 25% of the tourism emissions growth, and this growth is driven by consumption factors (expenditure per capita, population, and private car use).
As this infographic shows, despite efficiency improvements of 0.3% p.a., tourism emissions grew by a whopping 1.5 Gt between 2009 and 2019.
Use of this infographic
This infographic is intended for illustrative and informational purposes. Copyright 2024 tourismemissions.org. All rights reserved.
When using these infographics, please include the following source acknowledgement: Source: tourismemissions.org
Readers should download the full published paper for detailed research results, methodology, more detail around data sources and other relevant research parameters.